
Ben R. Hodges
University of Texas at Austin
A hydrostatic/non-hydrostatic grid-switching strategy for computing high-frequency, high wave number motions embedded in geophysical flows
ABSTRACT: Hydrostatic and non-hydrostatic models were used to simulate the generation of internal surges and associated soliton-like trailing waves from the non-linear steepening of low-frequency basin-scale waves. Results confirmed that the process cannot be modelled using the hydrostatic approximation. A grid-switching strategy was developed to reduce the simulation run-time of the non-hydrostatic model; a low-resolution grid using a hydrostatic computation of the flow field is dynamically switched to a high-resolution grid in the region of propagation of the leading internal surge, using a non-hydrostatic computation of the flow field. The strategy takes advantage of the small time scale required for non-hydrostatic effects to become important such that a high-resolution grid is invoked only when and where these effects become large. Run-time reduction, conservation of the interpolation scheme involved in the grid switching and strategies for field scale studies were addressed. In relation to the laboratory experiments, the grid-switching strategy predicted the phase speed and the amplitude of the leading internal surge similarly to the uniform-grid models, however, the trailing soliton-like waves lost some of their signature. All non-hydrostatic models predicted the features of the energy flux path between low- and high-frequency waves.
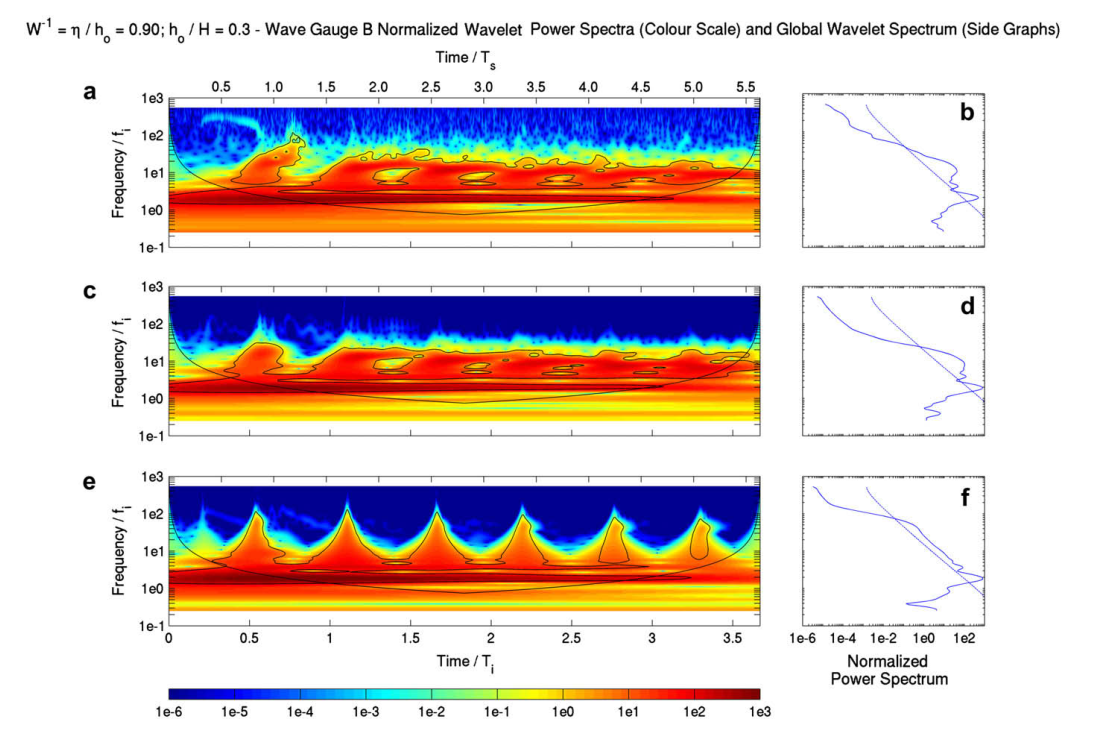
EXTRACT: Figure 6.

Fig. 6. Normalized wavelet power spectrum (in (a), (c) and (e)) and normalized global power spectrum (in (b), (d) and (f)) of interfacial displacements at wave gauge B and case W^{-1} = 0.90. Laboratory data in (a) and (b). Non-hydrostatic fine resolution model in (c) and (d). Hydrostatic fine resolution model in (e) and (f). The time was normalized by T_s (upper axis in wavelet plots) and by T_i (lower axis in wavelet plots). The frequency was normalized by the initial basin-scale frequency f_i. In the wavelet plots, contour lines indicate the 95% significance levels, while the line linking the top left corner to the right top corner indicates the are where edge effects due to padded zeroes in the Fourier transform have an influence on the results (see Torrence and Compo, 1998). In the power spectrum plots the dotted line indicates the 95% level of significance.