
Ben R. Hodges
University of Texas at Austin
Integrating Google Maps/Earth in an automated oil spill forecast system
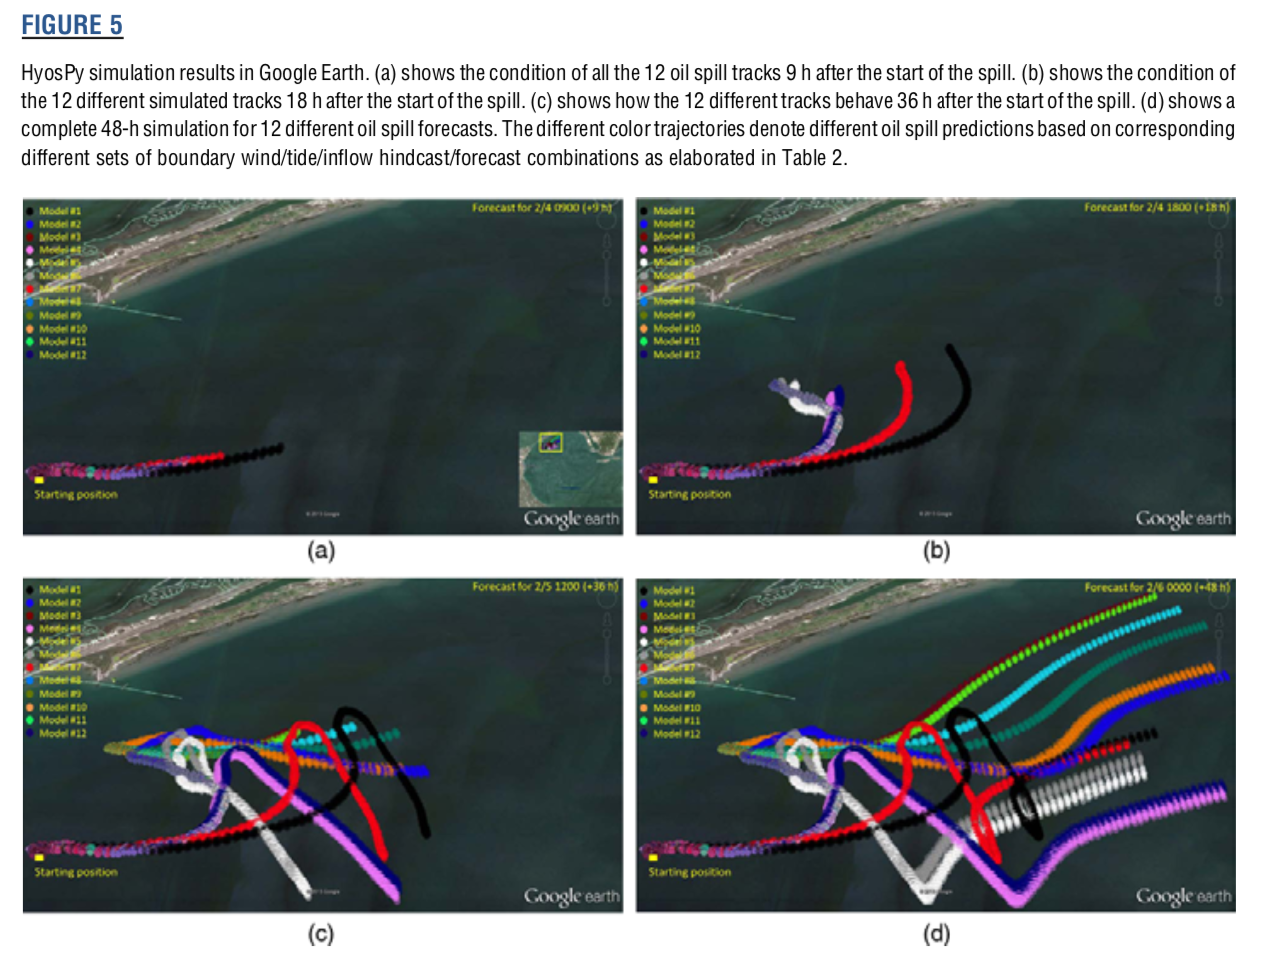
ABSTRACT: An automated method for visualizing oil spill forecasts using Google Maps and Google Earth has been integrated into a Hydrodynamic and Oil Spill Python (HyosPy) modeling system. HyosPy downloads wind and tide observations and forecasts, runs a hydrodynamic model (the Semi-Implicit Eulerian Lagrangian Finite Element), links to an oil spill model (General NOAA Operational Modeling Environment), and visualizes the predicted spill trajectories. Using object-oriented approaches with Python code, HyosPy can run multiple instances of the hydrodynamic and oil spill models to provide a set of multiple predicted spill tracks controlled by different wind and tide forecasts. Automation of HyosPy allows the hydrodynamic model to be continuously running on a server so that hydrodynamic forecasts are immediately available in the event of a spill. Once the size, location, and time of the oil spill are provided to the system, no further human intervention is necessary. Google Maps/Earth visualization methods employ JavaScript tools and Keyhole Markup Language files to provide rapid display and animation in Web browsers of Java-capable devices. HyosPy is designed with a loosely coupled architecture to permit easy update and adaptation to different models and data sources.
